Sunday, December 30, 2007

Grid computing - using web browsers

Grid computing is one of those areas that seems to have a magic appeal to software developers. There is something very attractive about taking some relatively simple computers and wielding their combined power to perform seemingly infinitely large computing tasks within reasonable times.


I've also always been attracted to grids. But as many developers, I too thought this type of power was not within reach for me. Only since Google started documenting the "cloud of commodity PCs" that power their vast computing power, does it suddenly seem quite feasible for even just "large" companies to have their own computing cloud.


But my problem remains the same. I don't work for Google, Yahoo or IBM and I'm not a large company myself. So I don't have access to a set of commodity PCs that I can combine into a grid. So for years I decided that I'd never get a chance to work on a grid, unless I'd start working for one of those big boys.

Recently I've been thinking about an alternate setup for a grid computer, more along the lines of the SETI@Home project and all its successors. Those programs all allow home PCs of users all over the world to take part in a giant computer network - a global grid in essence. So the people creating these programs get a lot of computing power, yet they don't have to manage the hardware. A powerful setup.

But such setups already exist. And they have one downside that keeps them from even more mainstream adoption: they require the user to install software to put their computer into the grid. And although the threshold isn't very high, it's still too high for many people. So a lot of potential computing power is not used, because the barrier of installing software is too high.

Now that got me thinking: is there an existing platform on modern PCs that we can just embed our own grid applications in? Preferably a platform that's been around for a few years, so all its quirks are known. And it would be nice if the platform comes with built-in internet connectivity.

Here's the idea that popped into my head: web browsers! They used to be nothing more than HTML viewers, but those days are long gone. Nowadays our browsers are hosting more and more complete applications, like GMail, PopFly and Yahoo Pipes. These applications prove that there is a lot of computing power in the web browser. Is it possible to use the web browsers that people have open on their PCs all the time and turn those into nodes in the grid?

It is a very simple concept: every browser that has a certain URL open is a node in the grid. For a computer to join the grid, they just surf to the URL. To leave the grid again, they navigate away from the URL. It doesn't get much easier than that, right? No software to install, just a page you have to visit. Put it in your favorites in the office, open it every morning when you boot your PC and that's one more node in the grid. From even my own limited reach, I know of at least 5 machines that I could "grid enable" in this way. Those are all PCs and Macs that are on for a large part of the day, just waiting for me or my family to use them. Or that's what they used to be... now I can't stop thinking about them as being nodes in my "web based grid".

If you're a software developer reading this, than your mind probably started wandering while reading the last few paragraphs. Is this possible? How would the nodes get their tasks? How would they report their results back? How would you manage the nodes in the grid? Where do you keep the data that is needed for/generated by the nodes? How do you handle XSS issues? Wouldn't the nodes quickly overload the server that manages them? The list of challenges is seemingly endless and definitely too much for me to deal with in one go.

All I know is that ever since this idea popped into my head, I can't stop thinking about it. And for every problem, I can see at least a few potential solutions. I have no idea whether they'll work or which one is best, but the only way to figure that out is to actually start building the platform.

Oh man... I really need to make this my 20% project. Or more likely... I really need a lot of people to make this their 20% project. Help?

Saturday, December 22, 2007

The origin of the name Apache web server

I read a lot. Not much literature and novels as unfortunately those seem to suffer under my more professional reading habits. I read lots of technical articles, white papers, blog posts and specifications. It's part of what I do to keep up to date with the things happening in the CS field. But in part I also read all kinds of stuff to gain a broader understanding of our profession.

Some of the longer things I read this year include "PPK on JavaScript", "The no asshole rule", but also the venerable "Art and science of Smalltalk". And some colleagues even caught me reading an OS9 AppleScript manual dated somewhere around 1999. They're still making fun of their discovery almost every day, but I don't mind... having read that manual has given me a better understanding of how the now much heralded Apple engineers thought about making an end-user programming language almost a decade ago.

Recently I read the bulk of Roy Thomas Fielding's thesis Architectural Styles and the Design of Network-based Software Architectures in which he introduces the principles of REST. As with any thesis it is a bit too abstract for my taste, but it did introduce me somewhat better to the background and theory behind REST.

Aside from that, I made one stunning discover when I read about Fielding's involvement in the creation of the Apache HTTP server:

  • At the time, the most popular HTTP server (httpd) was the public domain software developed by Rob McCool at the National Center for Supercomputing Applications, University of Illinois, Urbana-Champaign (NCSA). However, development had stalled after Rob left NCSA in mid-1994, and many webmasters had developed their own extensions and bug fixes that were in need of a common distribution. A group of us created a mailing list for the purpose of coordinating our changes as "patches" to the original source. In the process, we created the Apache HTTP Server Project
Please read that last part again, and again... and again. Until it hits you where it finally hit me. What hit me? Well... I finally understood that the name of the Apache web server might (originally) have had nothing to do with the Apache tribe. The server was created by taking an existing code base and then applying all sort of patches. So in a sense it was a patchy web server. A patchy... Apache...!

Brilliant! In all my years of knowing the Apache web server and the brand that was created around the Apache name, I never realized where it came from.

The Apache website itself has this to say about it:
  • The name 'Apache' was chosen from respect for the Native American Indian tribe of Apache, well-known for their superior skills in warfare strategy and their inexhaustible endurance. It also makes a cute pun on "a patchy web server" -- a server made from a series of patches -- but this was not its origin.
For the moment I'll take their word for it and accept that the name sounding like "a patchy web server" is pure coincidence. I bet it's also more convenient for them in selling the Apache brand: "we named our web server after its inexhaustible endurance" sounds a lot better than "we named our web server after the fact that it was created from a bunch of unrelated patches".

Saturday, November 17, 2007

Why devx needs a better print function

I like to read technology articles during my daily commute. And since the train is too crowded for a laptop and I don't have an ebook reader (yet), I still print articles that seem interesting to read during the train ride.

A lot of web sites still have a Print button. What happens when you click that button differs from site to site, but it roughly falls into these categories:

  • Show all pages at once
    Many sites break articles into multiple pages. The print version of the article puts all of these pages together again, to allow them to be printed in one go.
  • Re-layout the site to print better
    Tables seem to be notoriously difficult to print. That's why many sites revert to a table-less layout in their print version
  • Remove navigation elements
    Global and local navigation elements are pretty useless on paper. So they're removed from the print layout.
  • Images - click to see full size version
    Some graphics-intensive sites show images of reduced size in their normal view, showing the full version in a popup when you click some link. Since you can't click a link in the Print version, the full size images should always be shown there.
These are some things that I wish more site would do:
  • Replace animated adds by text adds
    I don't mind showing adds next to good content. I do mind the ignorance of including animated adds in a print layout. I'm pretty sure no printer will deal with these in a useful way.
  • Use images that are more appropriate for B&W
    Most people still use B&W printers. So it would be nice if sites allowed the option of replacing their colored images with version that are more suited to printing on a B&W printer.
    A common example of this are mostly-black screenshots like from command prompts/shell windows. When printed these really eat through a toner at high speed. It would be nice if a site would allow me to replace those images with ones that are mostly white, making my toner last longer.
That's a pretty long list. And most of these things can actually be accomplished on a website without needing a special print version of the articles. Hiding navigation elements, showing non-animated adds and other layout tricks on a print version can easily be accomplished using CSS media types. And why do most sites still use tables for their layouts? Just remove those tables and you have one less difference between the screen and the print version. And I also think it would make sense to show all content on a single page.

So that actually leaves just one reason for having a Print button: showing full sized images inline. And that finally brings us to the title of the article: the print function of DevX.

DevX is a nice development site that sometimes has very interesting content. And one of the reasons their content is good is that they usually include quite a lot of screenshots and diagrams. This just makes their articles so much easier to follow. On screen the articles show the images at a reduced size. Which makes sense, because the images are often full screen screenshots which would otherwise leave hardly any room for text.

But if you've ever printed an article from www.devx.com you've probably noticed their print versions still only show the images with a reduced size. They're not replaced by the full-resolution version. They're not printed in a larger box. They're not even added at the end of the article, like appendices. The images in the print version are exactly the same as in the screen version: reduced to sometimes a tenth of the the original size.

So whenever I find an article in DevX that I want to read on the train, I start up Word and open the print version in there. Then I remove all tables, because they also don't print very well from Word. Then I go back to the browser and open each image, copy it to the clipboard, paste it in Word and then remove the useless downsized version.

And although I normally like the high volume of screenshots that DevX uses in their articles, this is actually a reason why I'd like them to use less screenshots and more text. Because this conversion to Word is not just a lot of mindless work; I sometimes forget to do it and print a DevX article as is. And by the time I realize what I've done, I'm already on the train. So I do my best and squint my eyes trying to read the text in there.

So there you have it: please DevX fix your @$@%&^# Print function.

Saturday, October 6, 2007

Viewing and editing Scrum project management data with Google Mashup Editor

Welcome to my first post on the Google Mashup Editor. In this article we'll create a tool for entering and storing data using Google's new mashup editor tool. Depending on available time, the evolution of Google Mashup Editor and the availability of alternative tools, I might improve on the basic data management application in later articles.

Scrum project management

The application we'll be creating is a Scrum project management tool. If you don't know Scrum yet, it's an agile project management framework. Please do yourself a huge favor and read this 90 page story about Scrum (pdf). It's a good and fun read and has already won over many organizations to at least give Scrum a try.

My reasons for wanting to create this type of application are many. One of them is that there seems to be no tool that satisfies my needs with the right price tag. XPlanner is good, but very basic. Mingle looks nice, but is too expensive and a real resource hog. ExtremePlanner also looks nice, but again: it seems a bit expensive for my taste. But one other reason is probably more important than the price issue: building this data model seems do-able and gives me a chance to get to know Google Mashup Editor a bit more.

Google Mashup Editor

Mashup tools seem to be a dime a dozen these days. These tools try to take programming to the masses, allowing everyone to create complex web applications based on existing data or logic.

Yahoo was the first big player in this field, with their Yahoo Pipes. They're aiming for a visual programming environment where the user manipulates blocks rather than writing code. Microsoft followed suit with Popfly, an even richer mashup creation environment combined with what seems to be the next generation of their MSN Spaces platform.

Google was the last entrant into this field (if I recall correctly) and the first glances at their entry into the field left me rather disappointed. No drag-and-drop programming, no cool default widgets, just a pretty basic text editor and some basic tags.

But if you look below the surface you can see that Google Mashup Editor (GME) is actually quite different from the other two. Where Yahoo and Microsoft just seem to focus on allowing you to read and combine data from various sources, Google also allows you to create new applications from scratch. In that respect GME is more of an application creation (and hosting) platform than a mashup editor.

Much of these additional possibilities seem so originate from Google's adoption of the Atom Publishing Protocol, exposed through the Google Data (GData) APIs. This API is what makes GME not only a mashup editor, but also a valid tool for creating completely standalone applications. These applications are then hosted on Google's servers, using Google's servers for data storage, using the GME to create and update the applications. Some people might not like to put so much in the hands of Google. But it will certainly lower the bar for creating scalable web 2.0 applications.

That's enough of the background talk. Let's get to work on the application.

Initial data model

We'll start by defining the basic entities and relations in our application. We'll probably expand on these later, but we can get pretty far with just the following.

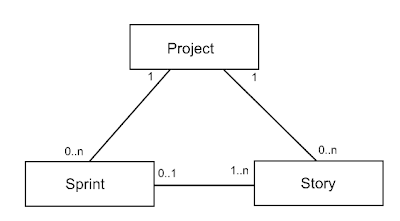
A project is something on which a team works in sprints to create a product or a release of a product. This is all intentionally very vague, as our application doesn't need to know the details of the projects it manages.

A project has a product owner and a scrum master. Aside from that there are other team members, but we'll leave them out of the equation for now.

A sprint is a time period during which the team implements certain stories. A sprint has a start date and end date and a description of the general goal of the sprint.

A story is a piece of functionality that the team creates. It has a name, a description of how to demonstrate it and an estimate of the effort it will take to create the functionality. Stories can be either user-focused or technical in nature.

All stories combined are called the product backlog. Stories from the product backlog are planned into sprints. So each project has one product backlog and some of the stories in this product backlog are planned into each sprint.

This all translates into the following very simple data model:
Let's see how we can translate this data model into GME.

Creating the project list in GME

The first step is to create a new project in GME. This will show you a nice empty application with just a pair of gm:page tags.

<gm:page title="Scrum Project Manager" authenticate="true">

</gm:page>

Everything for our application will be inside the gm:page tags. If you want your application to have multiple pages, just add some more files to it. But for this application a single page will do.

Getting data into GME consists of two steps: defining the data itself and defining the GUI for it. The data itself takes the form of a gm:list tag:

<gm:list id="Projects" data="${app}/Projects" template="projectList" />

The gm:list tag defines a list of data that is used in the application. In many applications the data will be pulled from an external -RSS or Atom- feed. But we want to store the data inside the application, right in Google's mashup servers.

The data of our project list is stored under the ${app}. This is a location (a "feed" in GME terms) where the data of all users of the application is stored. If we don't want to share the data between users, we can store it under ${user}, which is data that is kept per user. Currently there is no way to have data shared between some users (but not all users of the application), although this feature will probably be added in the future.

To display the data in the list, the page needs a template. A template determines what fields to display and how to display them. It's easiest to use an HTML table, so we'll do that for now.

<gm:template id="projectList">
<table class="gm-table">
<thead><tr>
<td width="200">Name</td>
<td width="100">Product owner</td>
<td width="100">Scrum master</td>
<td width="45"> </td>
</tr></thead>
<tr repeat="true">
<td><gm:text ref="atom:title" hint="Project name"/></td>
<td><gm:text ref="gmd:productOwner"/></td>
<td><gm:text ref="gmd:scrumMaster"/></td>
<td><gm:editButtons/></td>
</tr>
<tfoot><tr>
<td colspan="4" align="right"><gm:create label="New project"/></td>
</tr></tfoot>
</table>
</gm:template>

As you can see we're mixing standard HTML tags, with GME specific tags like gm:text, gm:editButtons and gm:create. Also notice the non-HTML repeat attribute on the second tr (a normal HTML table row). This tells GME to repeat that tr for every item in the ${app}/Projects feed.

If we now compile and test this application, we get an empty table with a "New project" button. Pressing the button adds an empty row to the table, with fields to fill in the values for a product.
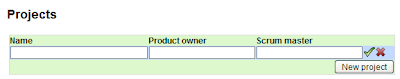
Note that editing and creation functionality are for free with GME. Although they're not very flexible, they allow you to quickly get started.

Creating the list of stories in GME

Next is a list of stories for a project. Since stories are always part of a project, we store the data under the feed of a project.

<h2>Stories for selected project</h2>
<gm:list id="Stories" data="${Projects}/Stories" template="storyList" />

This is where GME really adds a lot of logic automatically. The location refers to a child of the ${Projects}/StoriesProjects list we defined earlier. Each project in the Projects list will have its own list of Stories.

This list also needs a template to display it, which is really similar to the one for the projects.

<gm:template id="storyList">
<table class="gm-table">`
<thead><tr>
<td width="200">Title</td>
<td width="75">Type</td>
<td width="25">Estimate</td>
<td width="100">How to demo</td>
<td width="45"></td>
</tr></thead>
<tr repeat="true">
<td><gm:text ref="atom:title" hint="Story title"/></td>
<td>
<gm:select ref="gmd:storyType">
<gm:option value="user" selected="true">User</gm:option>
<gm:option value="tech">Tech</gm:option>
</gm:select>
</td>
<td><gm:number ref="gmd:estimate"/></td>
<td><gm:text ref="gmd:howToDemo"/></td>
<td><gm:editButtons/></td>
</tr>
<tfoot><tr>
<td colspan="5" align="right"><gm:create label="New story"></td>
</tr></tfoot>
</table>
</gm:template>

Now the only tricky bit we still need to do for the list of stories, is that it needs to be refreshed when the user selects a different project. This is quite easy, by setting an event handler.

<h2>Unplanned stories for selected project</h2>
<gm:list id="ProjectStories" data="${Projects}/Stories" template="storyList">
<gm:handleEvent src="Projects"/>
</gm:list>

This tells the story list to refresh itself when an event happens in the Projects list we defined before. So select a different project will display the stories for that project.

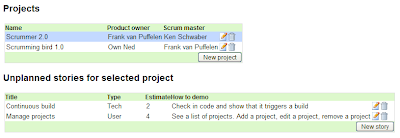
So after adding the story list and adding some projects and stories, our application looks like this:
We can easily do the same for the list of sprints for the project. Since this is really similar to the list of stories, I won't show the code here. If you want to have a look at the code, look at the finished project on http://scrummer.googlemashups.com.

Last is the list of stories for the selected sprint. Note that stories can either be part of the project or part of the sprint. So for now we'll call the first type "unplanned stories". Later we'll want to share the stories between the project and the sprints.

Since the list of stories is -again- really similar to the list of unplanned stories, we won't show the code here. But when we now run our mashup it looks like this:
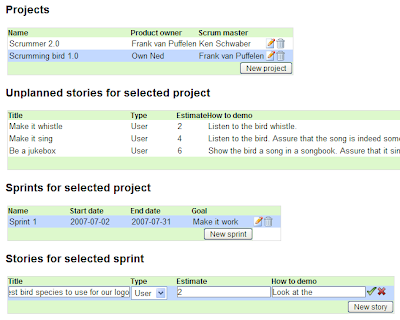
At the bottom you can see that I am entering a story. This is almost a usable application, at least for entering and browsing the data. To make it something you'd really want your entire team to use for your daily managing of Scrum projects, it would require more work.

That's it for now. If you want to have a look at the finished code or play with the application, go to http://scrummer.googlemashups.com.

Saturday, August 25, 2007

Online burndown chart generator

One of the aspects of Scrum is its focus on transparency - getting all information out in the open. And one of the areas that enables the transparency is the burndown chart. It's a public posting of the progress of the team throughout its current sprint.

On the horizontal axis you see the days of this sprint. The vertical axis describes the amount of work. At the top of the vertical axis is the number of "ideal man hours" we committed to for this sprint. The straight diagonal line is the "ideal burndown" that we're aiming for. The slightly less straight line is our actual burndown. As you can see this chart is from somewhere during the third week of our four-week sprint and we're slightly above target. But things don't look as desperate as a few days before, thanks to some colleagues getting back from Holidays (which it says in the small scribling that you probably can't read).

As a Scrum master I like to post this information as publicly as I can. So just having it on the wall of our team room isn't good enough, since there are many people that don't visit our team room. Ideally I'd like to have the burndown chart projected on a wall in the central hallway of our office, so everyone can see it first thing they come in in the morning. But as a nice step along the way to this, I chose to publish the chart (and the rest of our product backlog) on our project wiki.

In the first sprints I did this by taking a photograph of the burndown chart every morning, right after updating it. I'd then upload the photo to our wiki. The only problem is... uploading them every day turned out to be too much of a hassle. So the wiki actually only got updated once a week. And that's not good for transparency of course.

So this time around we went searching for a simple tool that would lower the threshold of updating the burndown chart on our wiki. We searched for an extension to MediaWiki that allows you to create a chart by just entering the numbers in your wiki text. That turned out to be quite a challenge. There are many charting and drawing extensions for MediaWiki, but they either didn't do what I wanted or we couldn't get them to work on our wiki.

In the end I just gave up and wrote a simple web page that -when fed with the right parameters- will return a PNG image of the burndown chart. You call the page like this:

  • burndown.jsp?days=1,2,3,6,7,8,9,10,13,14&work=200,170,165,150,125,95
And the page will return the following image:
So the days parameter indicates the day numbers shown on the bottom. I entered all of them for the entire sprint right away. The work parameter is the work remaining. I just entered the values that I know, which is why the green line stops halfway through.

The generated chart is really simple and not very pretty. But it is very easy to keep up to date and that's what counts most. I just add the remaining hours at the end of the URL every morning... and that's it.

Although I consider this generator a stop gap solution until I find something better, I imagine it might also be useful to other budding Scrum masters. For that reason I've put the page online for public use at http://apps.vanpuffelen.net/charts/burndown.jsp. Just click the link and you'll get some usage examples.

Let me know if this generator is useful to you in the comments section. Also let me know if there's something wrong with it and I'll do my best to fix it.

Update (January 1st, 2010): in my company we've created a custom version of this same tool and used that in many projects over the last few years. This public burndown generator has drawn over 60.000 charts in 2009 alone, so apparently we're not the only ones who use burndown charts. That's why I've now updated the tool with the best features that we've added over time at my company. Check the latest version on http://apps.vanpuffelen.net/charts/burndown.jsp for all the features and let me know what you think of them.

Sunday, August 19, 2007

Scrum: utilization vs. velocity

At work we're recently started using Scrum for running some projects. As expected we need to slowly learn the lessons. One of the things we're been having a lot of discussion on recently is the meaning of the focus factor. Let me begin by explaining what a focus factor is, at least in my company.

To determine how much work you can do in a sprint, you need to estimate the top stories. We estimate these stories in "ideal man days" using planning poker. This means that each developer answers the question: if we lock you into a room each day without any distractions, after how many days would you have this story finished?

After these estimates we determine people's availability for the project. After all, they might also be assigned to other projects, if only for part of their time. Even people that have no other projects, tend to have other activities. Like answering questions from customer support or consultants, department meetings, company wide meetings, job interviews with candidates or just playing a game of fusball, table tennis or bowling on the Wii. So basically nobody is available to a project 100% of the time. At most it's 80% - 90% and on overage it seems to be about 60% - 70%.

So the first stab at determining how much work someone can complete is:

  • available hours = contract hours * availability
But when you're working on the project, you're not going to always be contributing towards the goals that you've picked up. Within Scrum there is the daily Scrum meeting. It lasts no more than 15 minutes, but those are minutes that nobody in the team is working towards the goal. And after the meeting a few team members always stick around to discuss some problem further. Such time is very well spent, but it probably wasn't included in the original estimate. So it doesn't bring the "remaining hours" down very much. I see all this meeting, discussion, coaching and tutoring as necessary work. But work that doesn't bring the team much closer to the goal of the sprint. I used to call this overhead, but that sounded like we were generating waste. So in lieu of the agile world I switched to using the term focus factor. So now we have:
  • velocity = contract hours * availability * focus factor
So the speed at which we get things done (velocity) is the time we're working minus the time we loose to non-project work minus the time we loose on work that doesn't immediately get us closer to the goal. In the past I probably would have included a few more factors in there, but in an agile world this is already accurate enough to get a decent indication of how long it will take us to get something done.

If there's one thing I've learned from the agile movement and Scrum it's to focus on "when will it be done" instead of "how much time will it take". So to focus on velocity instead of utilization.

Utilization is the territory of classic project management. It's trying to make sure that every hour of every employee is fully accounted for. So if they're programming, they should have a time-writing slot for programming; if they're meeting, there's a slot for meeting; if they're reviewing designs, there's a slot for that and if they're drinking coffee or playing the Wii... you get the picture. Of course there's no project manager that wants all that level of detail. But in general they are focused on what you're spending your time on.

Agile thinkers see this really differently. They say: it doesn't really matter how much time you spend, what matters is when it is done. This sounds contradictory so let's see if a small example can make it clearer what I'm trying to say.

If I tell my boss that some feature he wants will be done at the end of next week, he is interested in only one thing: that it is done next week. If we get it done on time, he doesn't care whether I spent two hours per day on it or whether it was twelve hours per day. I care about it of course, because I don't want to work late every night. And there's also a limit to the amount of gaming I like to do during a day, so two hours per day will leave me bored quickly. But to my boss, all that matters is when I deliver, not how much effort it took.

This is why the focus for Scrum projects is on velocity and not on utilization. So in Scrum you want to know how many hours you still need to spend on a job, not how many you've already spent on it. A classic project manager might be really proud that you worked late all week and clocked in 50+ hours. An agile project manager will note that you reduced the "hours remaining" by 10 hours and nothing more. If you're looking for compliments on all your hard work, then Scrum might not be for you.

Learn more:

Saturday, August 11, 2007

Will wireless work?

Friends often call me a geek. They mean no offense, so I try to take none. As Chris Pirillo once put it: "geek used to be a four letter word, now it's a six figure one". Well... that last part isn't exactly true for me, but that's probably only so because I get paid in euros instead of dollars.

Part of what makes me a geek is the fact that I tend to be an early adopter of new technologies. I got my first always-on internet connection in 1996 paying somewhere around 40 euros for a speed that never seemed to top 1.5 kbps. Yes, that's kpbs for kilobits per second - so about 40 times slower than an analog modem. But it was always on... so I was one of those people that knew they had email a few seconds after the other party had sent it.


I bought an XDA in 2001, which was the first touch-screen phone/pda with an internet connection. It was what you'd call an iPhone these days, although it had to do with a lot less marketing. So for me: six years have brought us better marketing and a multi-touch screen. Still... I'l probably buy an iPhone when they're actually available here. Not because I need it. Just because I'm an early adopter.

As an early adopter you of course run the risk of buying things that will never catch on. Or becoming the involuntary beta tester of a device, which means the technology is not yet ready for prime time. One area where the latter happened to me is with wireless networking.
I bought my first wireless access point and card somewhere in 2001. It wasn't completely new back then, but it hadn't been adopted by the masses yet. So usability and interoperability left something to be desired. USB wasn't as ubiquitous as it is now, so for a desktop PC I had to use a PCI to PCMCIA (now called PC-card and almost extinct) adapter. But hey... it worked... at times. But about half of the time it didn't work and I had to roll out a UTP cable again. I've tried to get a reliable wireless network over the years, but the devices either didn't work reliably or just broke down within a few months of service.

Somewhere in 2004 I just gave up on it and restored the cables to their full and permanent glory. So when whole tribes, states and even countries started using wireless networking, my house is completely wired. It's been like that for years now; first with really long UTP cables running down the hallways. They might not be pretty, but at least they work most of the time.


Two years ago I started using ethernet-over-powerline adapters, which use he powerline network in my house serves as a network. These adapters turned out to be as reliable as using direct UTP cables. So in my study I connect the ADSL modem/router to the powerline through one of these adapters. And in other rooms I connect computers to the powerline through another adapter. And it just works.

The adapters are ridiculously expensive and not very rugged, but they do give me the true plug-and-play experience that I never got with wifi. And even though having blue adapters in many wall sockets is not very pretty, it's a lot better than all those colorful UTP cables lining the floor. So -although expensive- I was pretty happy with it. Most people may prefer wifi, I've been sticking with ethernet-over-powerline.


A few weeks ago I saw a new device from Devolo: a wireless extender. So you plug this adapter into a socket and not only can you plug in an UTP cable, but it also provides wireless networking. So once again I couldn't resist and ordered one. If the whole world is using wireless without problems, I can't stay behind - can I?